Thursday, 15 March 2012

Self-Service Custom Infographics (@visually) in education


Sent to you by David Andrew via Google Reader:


via eLearning Blog Dont Waste Your Time by David Hopkins on 3/14/12

Visual.lyLike Infographics (I do), then you might like to try out Visual.ly, a tool that enables you to create your own (basic) infographic quickly and easily.

As reported on Mashable this week:

"The tool will eventually use APIs from sources including ESPN, the Economist and social media sites to compile and create data visualizations. At its launch, the startup is offering templates that use the Facebook or Twitter API."

How great is this – use a one-stop tool to generate an information resources for use in learning materials? OK, it is a little basic at the moment, and you'll need to be clever about how you input the details of information, hashtag, etc but you can get some good results, using the standard templates provided.

I see this as something that could grow into a valuable classroom resource, whether it is something we use to create and generate for the students to use or discuss, or something the students can use to generate work for a classroom activity, discussion, etc. how do you use infographics, and do you see this as something that you would use (if so, how?)

Here are a couple I created earlier (click to enlarge):
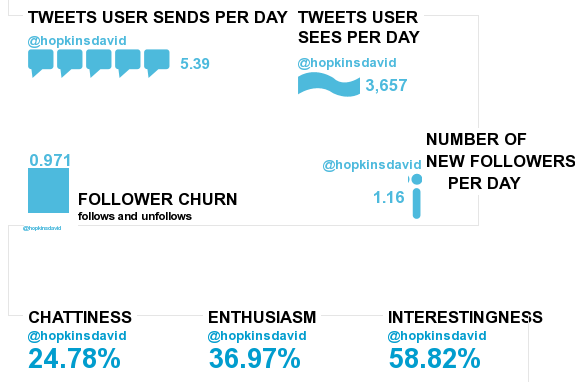

Visual.ly infographic for @hopkinsdavid

Visual.ly infographic comparing the Twitter accounts of The Eden Project and National Trust

However, be warned. I have not found it easy to create these, nor was it straight forward at all. On many occasions the infographic simply did not work, I was not able to download or embed it, I kept having new windows popping up all over the place, I was logged out countless times, and it is only through sheer determination that I continued and got these two above done – I would normally have given up long before now! I am sure the service will improve … ?

Related posts:

  1. Social Media and Social Network Educational Infographics
  2. Infographic: The Social Landscape
  3. Social Media in Universities (Infographic)


Things you can do from here:


Friday, 9 March 2012

Fast and slow visualization


Sent to you by David Andrew via Google Reader:


via FlowingData by Nathan Yau on 08/03/12

James Cheshire ponders the difference between fast and slow thinking maps, and the dying breed of the latter.

So do the renowned folks at the NY Times Graphics Dept. prefer fast or slow thinking visualisations? I asked them what they think makes a successful map. Archie Tse said what I hoped he would: the best maps readable, or interpretable, at a number of levels. They grab interest from across the room and offer the headlines before drawing the viewer ever closer to reveal intricate detail. I think of these as rare visualisations for fast and slow thinking. The impact of such excellent maps is manifest by the popularity of atlases and why they inspire so many to become cartographers and/or travel the world.

A graphic that takes a little while to understand doesn't always mean it was a failure in design. It might mean that the underlying data is hard to understand. Likewise, a graphic that isn't what you expect might let you answer different questions than from the usual standby.

[Spatial Analysis]


Things you can do from here:


Tuesday, 28 February 2012

Data Scraping Comes of Age With ScraperWiki.com

Data Scraping Comes of Age With ScraperWiki.com:

ScraperWiki Logo-1.jpgA scrappy company to help journalists dig into Big Data has come into its own in the past year, including the requisite all-night hacking codeathon this week at the Investigative Reporters and Editors Computer-Assisted Reporting Conference in St. Louis. The company is called ScraperWiki.com and was started by Julian Todd and Aidan McGuire, two U.K.-based analysts who have been long involved in opening up government data to the public.


Sponsor


Take a look at this data that was mined from the UN peacekeeping troop levels, as one example of what you can do. It is really like the Wild West of data visualization. Todd says in one blog post about his own data scraping efforts, "Look, you have just got all this way starting from nothing, from finding something out in the world, to recognizing its potential, all the way to pulling in and transforming the original raw data and struggling for a way to analyze it."


If you are interested in writing your own data scraping routines, you can watch several how-to screencasts on ScraperWiki here. You can program in php, Python, or Ruby. Most of the time you are gonna have to know some SQL code to work your way around these data sets. At the St. Louis conference, work was begun on scraping various public data sets such as the US federal prisoners or FDA drug and food recalls.


IRE.org also has a collection of different databases, too, such as ones on environmental data and campaign spending, but these are only available to member journalists.


There are even bounties to be had (not much, a couple hundred bucks) if you write your own data scraping tool and make it available as part of the Open Corporates effort.


Clearly, as more data becomes available online, scraping apps abound. But part of the problem is that journalists don't necessarily know SQL, let alone Ruby or where to find these treasure troves. That is where the conference and the codeathon this week come in handy, where dozens of folks learned how to start to take a stab at these visualizations as part of their reporting jobs. We're glad to see this happening!


Discuss